Sense
Capture stockpile geometry, material state, motion, visibility, or site conditions from the physical environment.
 LifeLine Technologies
 How it works
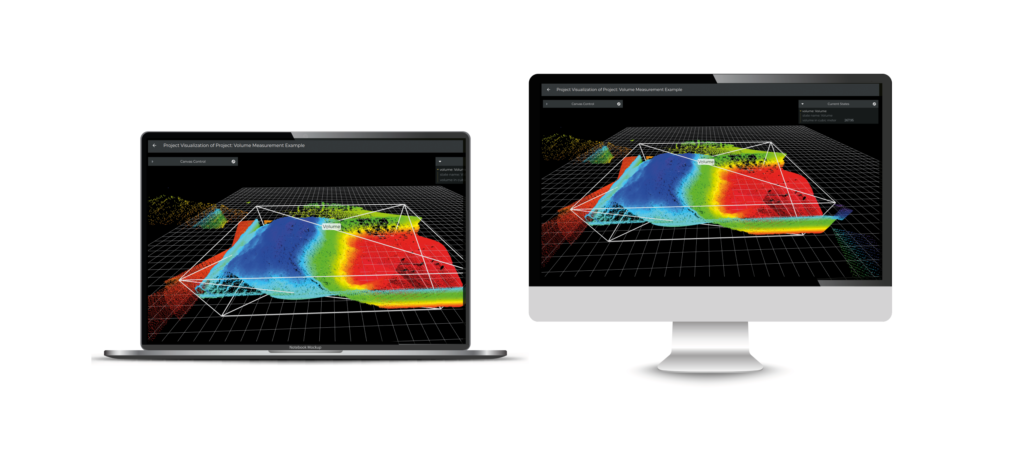
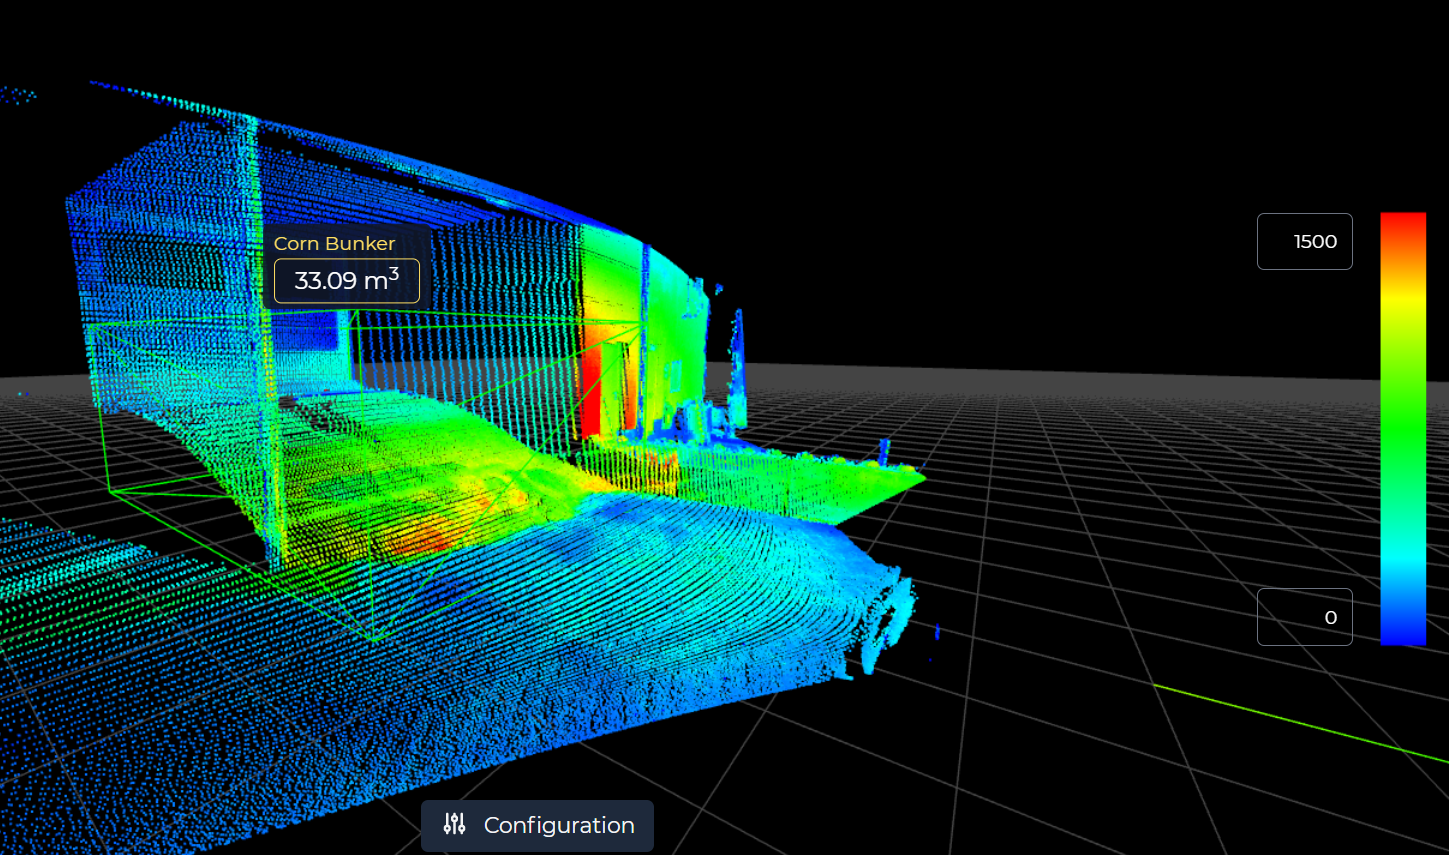
LifeLine uses LiDAR systems and visibility sensing to produce volumetric measurement for stockpile volume, fill level, material movement, access, and difficult environmental conditions. The output becomes inventory intelligence and operational visibility that teams can use.
What it means
The output is not a new stream of data for teams to interpret from scratch. It is a clearer view of current inventory and site state: what is present, what changed, what crossed a threshold, and what needs attention.
Sense, process, analyze, act
LifeLine starts with the inventory or operating decision, then designs the sensing and data path around the condition that needs to become clearer.
Capture stockpile geometry, material state, motion, visibility, or site conditions from the physical environment.
Filter raw data close to the site so operators are not flooded with sensor noise.
Compare inventory and site activity against zones, thresholds, fill levels, or visibility conditions.
Route the result to dashboards, alerts, reports, APIs, or the team responsible for response.
Zones and thresholds make sensor output useful for inventory review, routing, and exception handling.
Operational outcomes
LifeLine focuses on the handoff from measurement to action: what the system detects, how inventory or site events are described, and where the output goes.
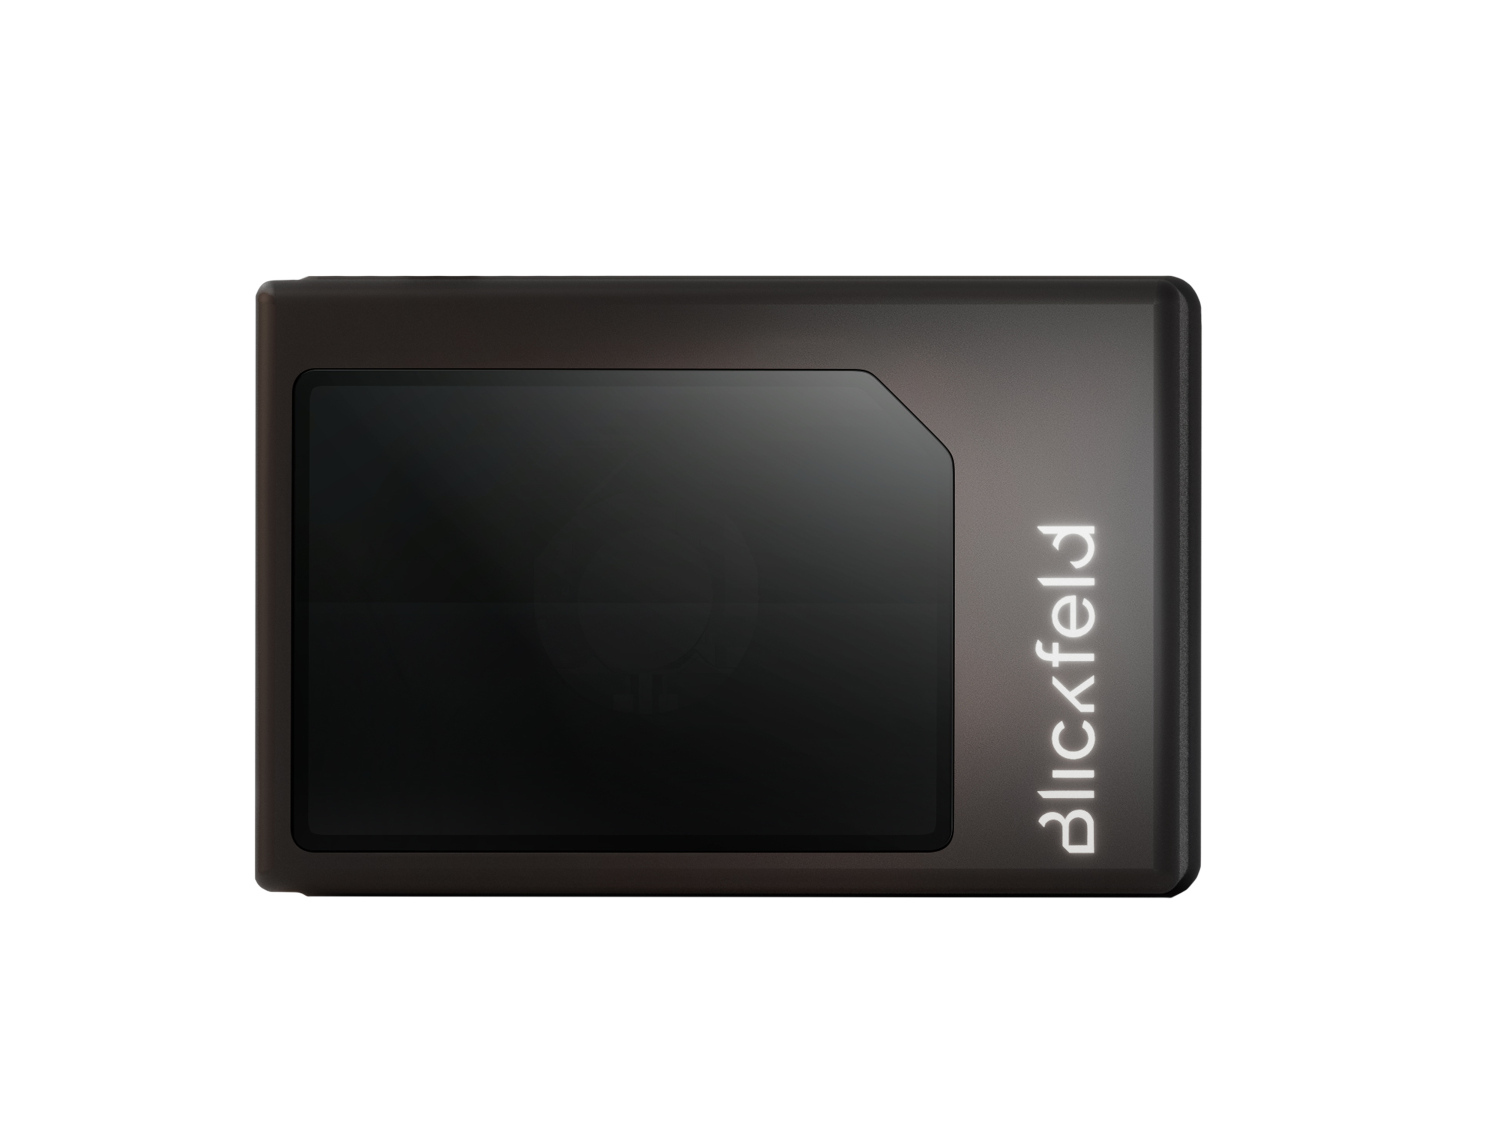
Sensing examples
LifeLine stays focused on the material or site condition first, then selects and integrates the technology around the deployment.
Useful when shape, distance, fill state, or defined-space activity needs to become a repeatable inventory or site signal.
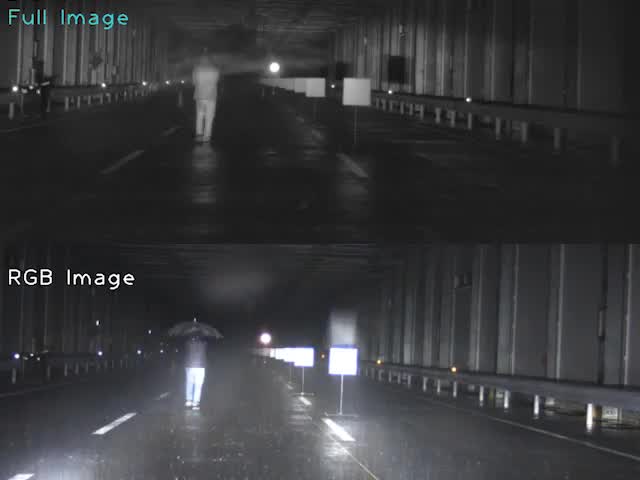
Useful when fog, glare, darkness, weather, or low contrast affects review and response.
What the review clarifies
LifeLine Technologies
Bring us the site, the constraint, and the decision your team needs to improve. LifeLine will review the sensing and delivery path.